Integrated Logistics connects purchasing, warehousing, transportation, inventory, and customer service through one coordinated operating system. Instead of treating each function as a separate department, it follows the product from supplier to final delivery. A delayed shipment, for example, can immediately affect warehouse labor, stock availability, and customer communication. This wider view helps managers identify causes rather than merely correcting visible problems.
In practical operations, Integrated Logistics depends on shared data, clear responsibilities, and measurable performance. Teams may track order accuracy, delivery time, inventory turnover, transport costs, and damage rates. A reliable platform can show when pallets leave a facility, where they are moving, and whether they meet agreed service levels. Still, technology alone cannot solve disconnected decisions. People need consistent procedures and realistic targets.
The business value is tangible. Better coordination can reduce duplicate handling, prevent excess stock, and improve delivery reliability. It may also support stronger supplier relationships because partners work with clearer forecasts and expectations. However, integration is not automatically efficient. Poor data, rushed implementation, or unsuitable software can create new delays. That limitation deserves attention.
From my perspective, effective logistics improvement begins with careful observation. Walk through the warehouse. Follow one order. Ask where information becomes unclear. Evidence from daily operations should guide investment, not attractive promises. Integrated Logistics matters because it links operational discipline with customer trust, although its success depends on continuous review and honest adjustment.
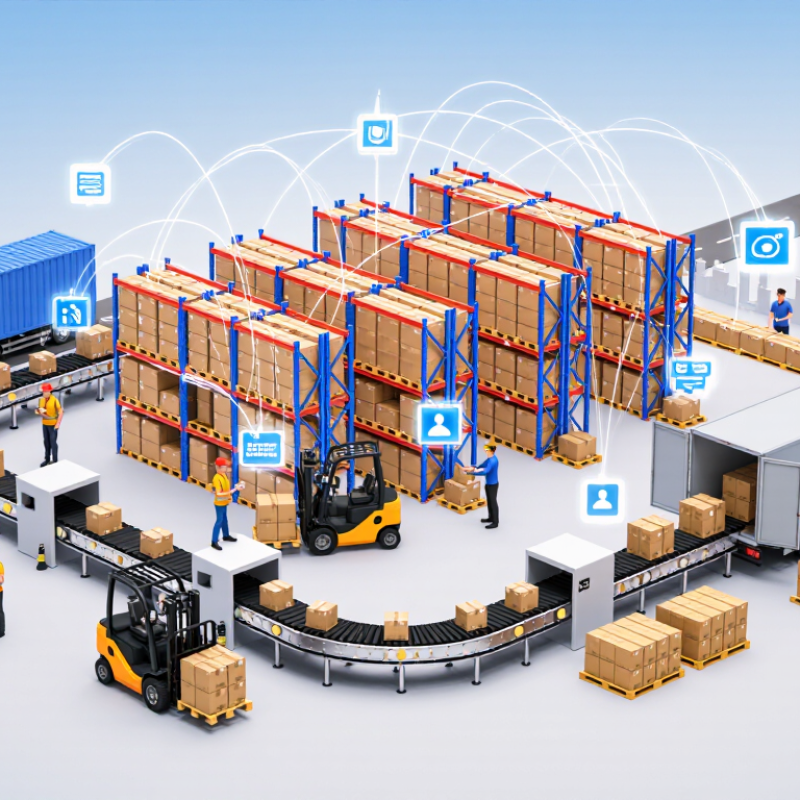
Integrated logistics treats transport, warehousing, and data as one operating system. A shipment should not become invisible after leaving the warehouse. Its order number, stock status, carrier handoff, location, and estimated arrival should remain connected. This allows teams to adjust picking schedules when a vessel is delayed or reserve dock space before a truck arrives. UNCTAD’s Review of Maritime Transport 2023 states that ships carry over 80% of global merchandise trade by volume. A small delay at one port can therefore affect inventory, labor, and customer commitments far beyond the dock.
The World Bank’s 2023 Logistics Performance Index reports that international shipments take about 44 days between export-port entry and destination-port exit. This represents roughly 60% of total trading time. Integrated data can expose where those days accumulate. A warehouse manager might see containers waiting, while a transport planner sees missing appointment data. One shared record can connect both views. However, integration is not automatically intelligent. A dashboard can still lie when teams enter late scans or use different product codes. That weakness needs regular audits, clear ownership, and practical staff training. In daily operations, the details matter: a barcode scan at 8:10, a temperature reading at 8:25, or a revised arrival time before the loading crew begins.
| Data Dimension | Operational Area | Core Data Element | Standard Unit or Formula | How Integration Uses the Data | Business Value |
|---|---|---|---|---|---|
| Order Flow | Customer order management | Order quantity, requested delivery date, destination, product identifier | Orders, units, dates, locations | Creates the demand signal used for inventory allocation, warehouse release, and transport planning. | Improves order visibility and reduces manual handoffs. |
| Transport Planning | Road, rail, air, and ocean movements | Mode, route, carrier assignment, planned departure and arrival | Shipment, kilometres, hours, calendar dates | Matches shipment requirements with available capacity, service constraints, and warehouse readiness. | Supports better routing and more consistent delivery planning. |
| Shipment Execution | Dispatch and in-transit control | Shipment status, milestone timestamps, proof of delivery | Status events and elapsed time | Connects transport milestones with customer notifications, exception handling, and inventory records. | Provides end-to-end shipment visibility. |
| Warehouse Receiving | Inbound receiving and inspection | Advance shipment notice, received quantity, lot or serial information | Units, pallets, cartons, timestamps | Uses transport arrival data to schedule docks, labor, inspection, and put-away tasks. | Reduces receiving congestion and improves inventory availability. |
| Warehouse Storage | Inventory location and control | Stock on hand, reserved stock, storage location, condition | Units, locations, percentages | Links inventory records to orders and replenishment decisions in near real time. | Helps prevent stockouts, excess stock, and misplaced inventory. |
| Warehouse Fulfillment | Picking, packing, and staging | Pick list, picked quantity, packing status, staging location | Lines per order, units, elapsed time | Releases work according to delivery priority, route sequence, and transport cut-off times. | Aligns warehouse activity with departure schedules. |
| Inventory Accuracy | Stock record control | System quantity compared with physically counted quantity | Inventory accuracy = accurate records ÷ records checked × 100% | Combines cycle-count results with order and replenishment data. | Improves planning reliability and reduces fulfillment errors. |
| Delivery Reliability | Final-mile and customer delivery | Promised delivery time versus actual delivery time | On-time delivery rate = on-time deliveries ÷ total deliveries × 100% | Combines order promises, warehouse release times, transport events, and delivery confirmation. | Creates a consistent measure of customer service performance. |
| Exception Management | Delays, shortages, damage, and documentation issues | Exception type, severity, owner, corrective action, resolution time | Cases, hours, financial impact | Routes alerts to the responsible transport, warehouse, or customer-service process. | Shortens response time and limits service disruption. |
| Cost Control | End-to-end logistics finance | Freight, handling, storage, customs, and accessorial costs | Currency per shipment, order, unit, or weight | Combines cost records with service levels, route choices, inventory, and warehouse activity. | Shows the total logistics cost rather than isolated departmental expenses. |
| Sustainability | Transport and facility impact | Distance, fuel or energy use, shipment weight, emissions factor | CO₂e, tonnes, kilometres, kWh | Combines movement and facility data to compare logistics options and report emissions. | Supports measurable environmental planning and reporting. |
| Data Governance | Shared logistics information layer | Common identifiers, timestamps, access rules, data quality status | Records, events, accuracy rate, update frequency | Keeps transport, warehouse, inventory, and order records synchronized across workflows. | Creates a reliable single view for operational decisions. |
It connects transport, warehousing, inventory, planning, and operational data in one shared system. The shipment stays visible.
Teams can connect order numbers, stock levels, handoffs, locations, and arrival estimates. This supports faster decisions.
A delayed vessel can change picking schedules, labor plans, and dock reservations before inventory runs short. Timing matters.
International shipments may take about 44 days from export-port entry to destination-port exit. That delay affects planning.
No. Late scans, conflicting product codes, and missing appointment data can produce misleading results. A dashboard can lie.
They should test alternate routes, review supplier capacity, and define clear escalation rules. Backup plans need testing.
Teams should compare fuel use, packaging, storage space, empty vehicle movements, and product damage. Cheap is not always cleaner.
Access should match job duties, with audit trails for important changes and protection for sensitive records. Too much control can slow urgent work.
Data conflicts, spreadsheet habits, and worker distrust may continue after systems are connected. Integration exposes weaknesses.
Regular reconciliation, staff feedback, training, audits, and independent reviews can reveal hidden errors. The system needs questioning.
Integrated Logistics is the coordinated management of transportation, warehousing, inventory, and data within one connected system. Instead of treating each activity as a separate function, it links physical operations with timely information, helping businesses improve planning, reduce delays, and respond more effectively to changing demand. Its importance grows with the scale of modern commerce, especially as U.S. logistics costs reached approximately $2.3 trillion in 2023 and maritime shipping continues to carry more than 80% of global trade.
A successful Integrated Logistics strategy should be evaluated through clear measures such as total cost, shipment visibility, delivery speed, and service-level performance. It must also address resilience, sustainability, operational risk, and responsible control of logistics data. By connecting partners, processes, and technology, integrated logistics can create a more transparent, flexible, and efficient supply network while supporting reliable service in a complex global environment.

 Fangding Rack